

3 Graphs Showing Why You Should Sell Your House Now
3 Graphs Showing Why You Should Sell Your House Now

There’s no doubt that 2021 is the year of the seller when it comes to the housing market. If you’re a homeowner thinking of moving to better suit your changing needs, now is the perfect time to do so. Low mortgage rates are in your favor when you’re ready to purchase your dream home, and high buyer demand may give you the leverage you need to negotiate the best contract terms on the sale of your house. Here’s a look at what’s driving this sellers’ advantage and why there’s so much opportunity for homeowners who are ready to move this season.
1. Historically Low Inventory
The National Association of Realtors (NAR) explains:
“Total housing inventory at the end of March amounted to 1.07 million units, up 3.9% from February's inventory . . . Unsold inventory sits at a 2.1-month supply at the current sales pace, marginally up from February's 2.0-month supply and down from the 3.3-month supply recorded in March 2020.”
Even with a slight rise in the number of houses for sale this spring, inventory remains near an all-time low (See graph below):
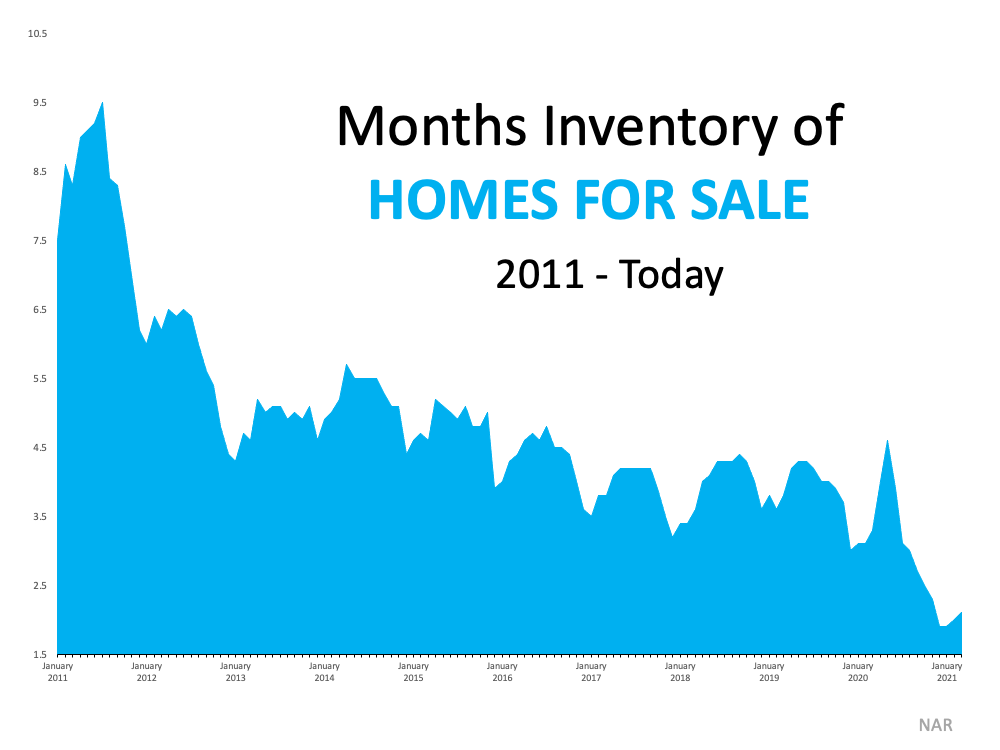
High buyer interest is creating a major imbalance between supply and demand, but as the small uptick in inventory shows, sellers are beginning to reenter the market. Selling your house now enables you to take advantage of buyer demand and get the most attention for your house – before more listings come to the market later this year.
2. Frequent Bidding Wars
As a result of the supply and demand imbalance, homebuyers are entering bidding wars at an accelerating rate. NAR reports the average number of bids received on the most recently closed sales is 4.8 offers. This number has doubled since the first quarter of 2020 (See graph below):
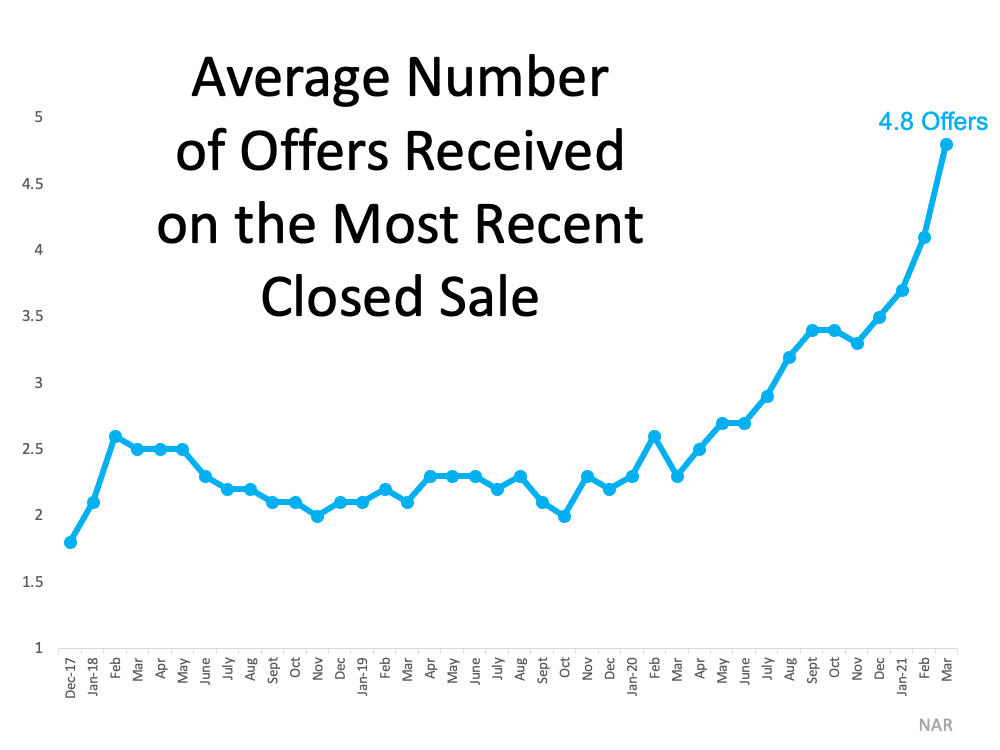
As buyers face increasingly tough competition while searching for homes to purchase, they’re more likely to be flexible and generous in their negotiations. This gives a seller the opportunity to choose the best buyer for their needs and be selective about things like time to close, contingencies, renovations, and more. Working with your trusted agent is the best way to determine how to navigate the negotiation process when selling your house.
3. Days on the Market
In today’s market, sellers aren’t waiting very long to find a buyer for their house, either. NAR reports:
“Properties typically remained on the market for 18 days in March, down from 20 days in February and from 29 days in March 2020. 83% of the homes sold in March 2021 were on the market for less than a month.” (See graph below):
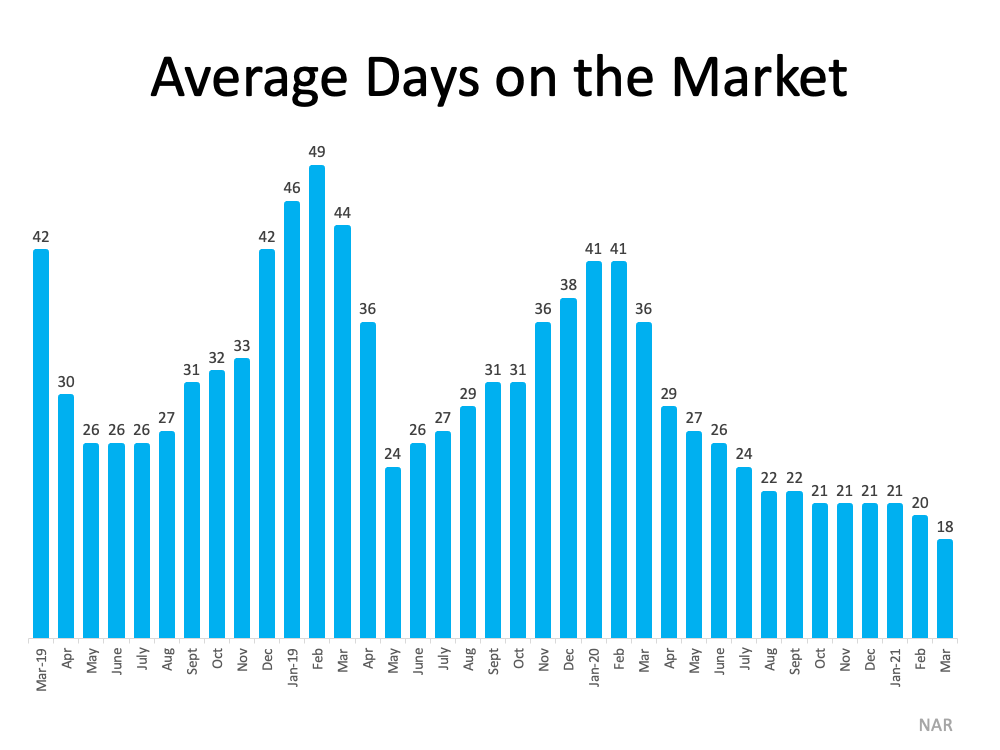
NAR Chief Economist Lawrence Yun explains:
"The sales for March would have been measurably higher, had there been more inventory…Days-on-market are swift, multiple offers are prevalent, and buyer confidence is rising.”
Bottom Line
If you’re thinking about moving, these three graphs clearly show that it’s a great time to sell your house. Let’s connect today so you can learn more about the opportunities in our local area.